Detecting and attributing tropospheric ozone trends
Tropospheric ozone is an air pollutant harmful to human health and vegetation near the surface and a greenhouse gas in the upper troposphere. It has risen since preindustrial times, but its trends differ with altitude and region, and internal climate variability can mask or mimic them. We combine chemistry–climate model ensembles, targeted sensitivity simulations, and observations to detect human influence on ozone trends and attribute them to their drivers.
Detecting a human fingerprint in satellite records
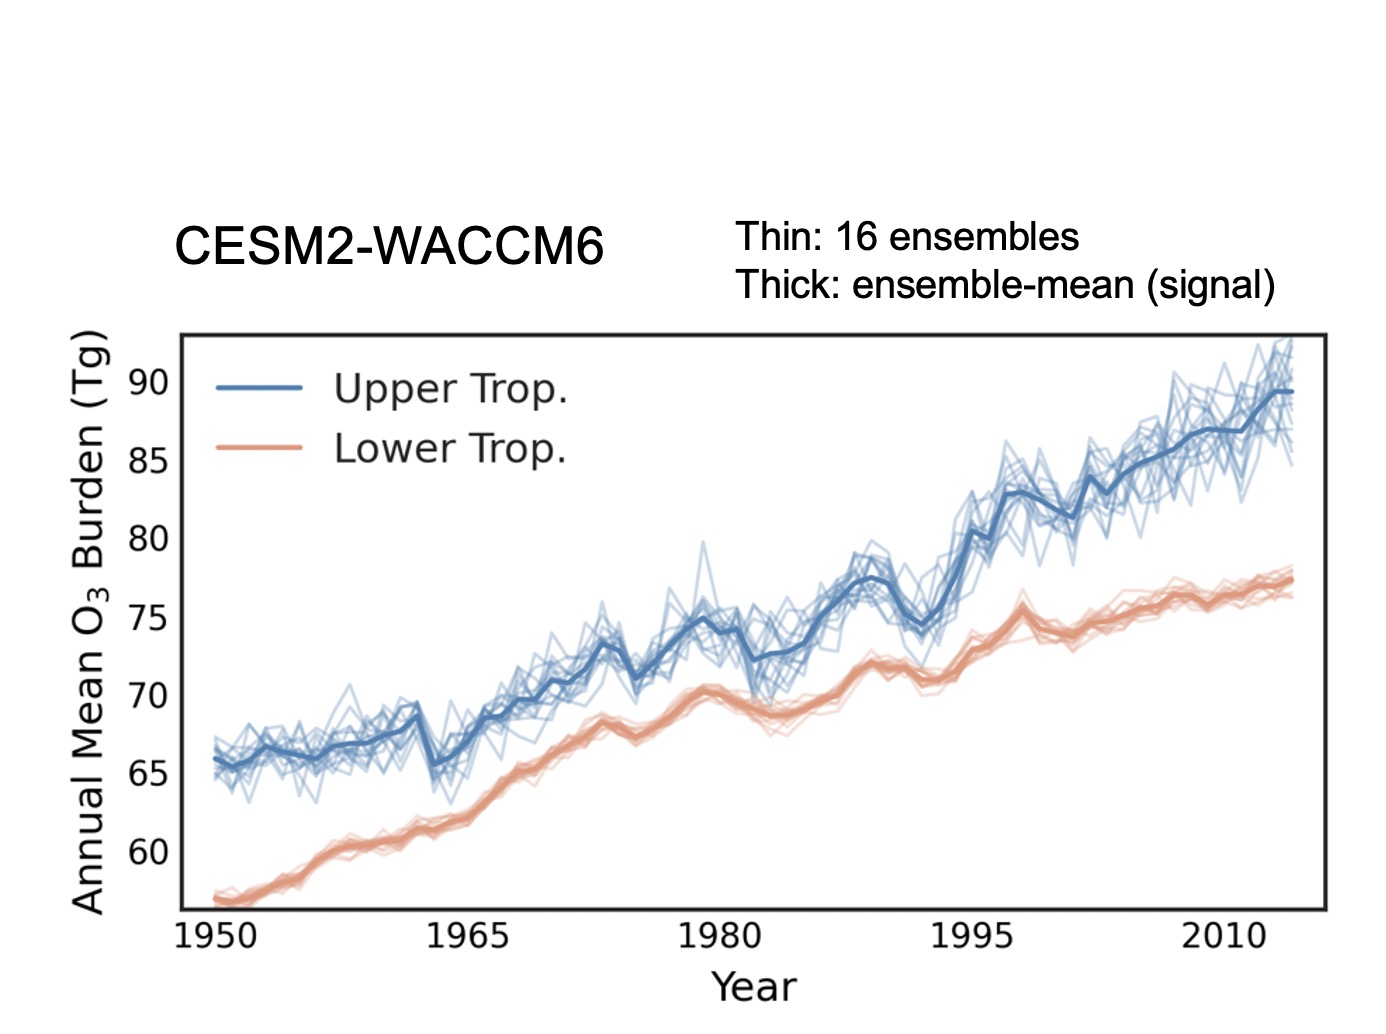
We ran an initial-condition ensemble of CESM2-WACCM6 simulations from 1950 to 2014. Every member sees the same human emissions but starts from a slightly different climate state, so the spread among members measures internal variability and their common response defines a human "fingerprint." Searching for that fingerprint in tropospheric ozone retrieved from NASA's Aura satellite over 2005–2021, we found it clearly: the increase in northern midlatitude upper tropospheric ozone reflects human activity rather than climate noise, and it is strongest over Asia.
Attributing the 1995–2014 increase to precursor emissions
To find out which emissions caused the increase, we perturbed one driver at a time in the 1995–2014 historical simulation: global and Asian surface anthropogenic emissions, NOx and non-methane VOCs separately, and methane. We found that surface anthropogenic NOx emissions are the main driver of the increase in tropospheric ozone, with Asian emissions playing a large role, and rising methane also contributes.
Ongoing: drivers in the lower and upper troposphere
Ozone trends near the surface and in the upper troposphere appear decoupled. Our ongoing work fingerprints anthropogenic and biomass-burning sources to explain what drives trends in each layer, and how internal climate variability affects our ability to attribute them. This study will be submitted to JGR: Atmospheres.